Module 4: synthetic workload evidence
Every figure has a description and its actual data table. This fixture contains deliberately constructed patterns; no trained model or real operational finding is represented.
Structured summary (JSON) · Plain-text summary · Normalized observations (CSV) · All chart descriptions (Markdown)
Synthetic workload exploration
Input rows: 25
Distinct observations: 24
Exact duplicates removed: 1
Labels normalized: 1
Total requests: 4180
Observed latency values: 23
Unavailable latency values: 1
Mean daily service p95 (ms): 38.7
Median daily service p95 (ms): 34.0
IQR investigation flags retained: 1
Descriptive synthetic evidence; no causal, production, or model-performance claim.
Latency Distribution
Download latency distribution table (CSV)
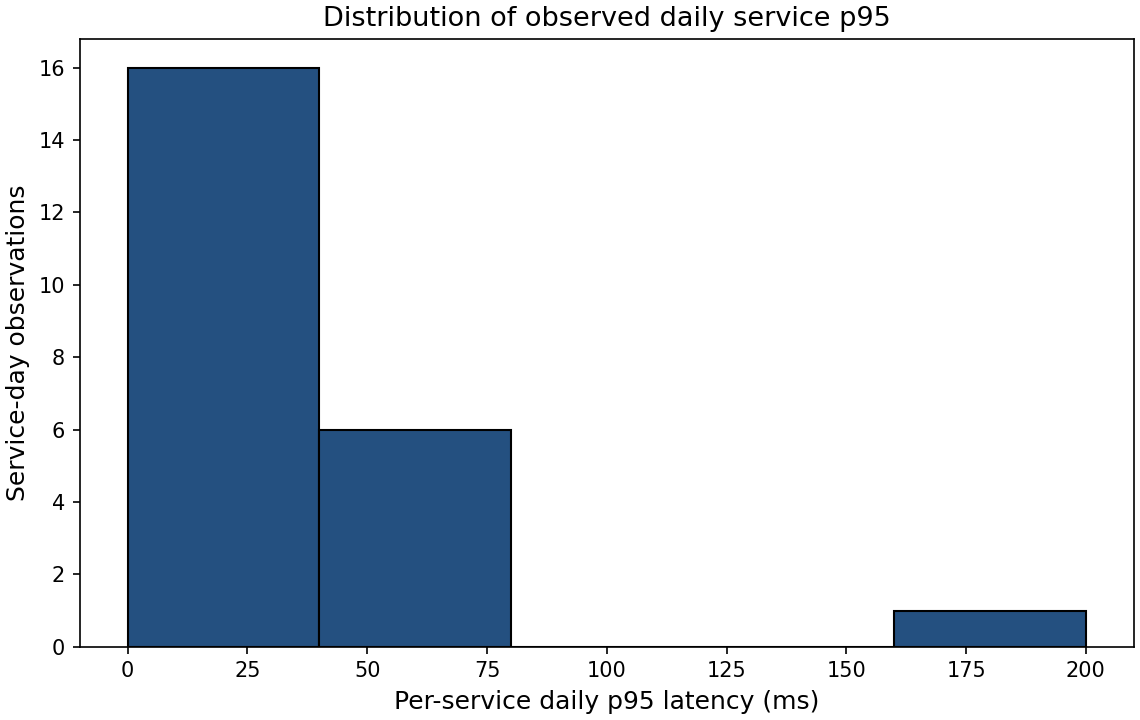
| lower_ms | upper_ms | count |
|---|---|---|
| 0.0 | 40.0 | 16 |
| 40.0 | 80.0 | 6 |
| 80.0 | 120.0 | 0 |
| 120.0 | 160.0 | 0 |
| 160.0 | 200.0 | 1 |
Service Comparison
Download service comparison table (CSV)
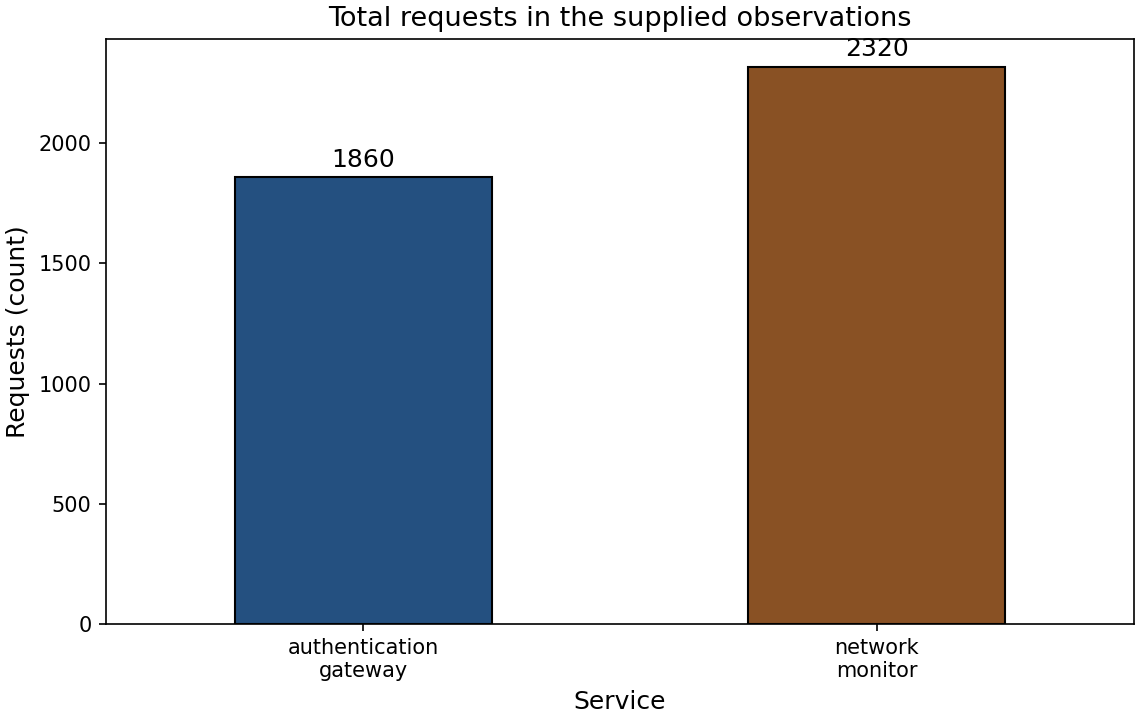
| service | requests |
|---|---|
| authentication_gateway | 1860 |
| network_monitor | 2320 |
Daily Requests
Download daily requests table (CSV)
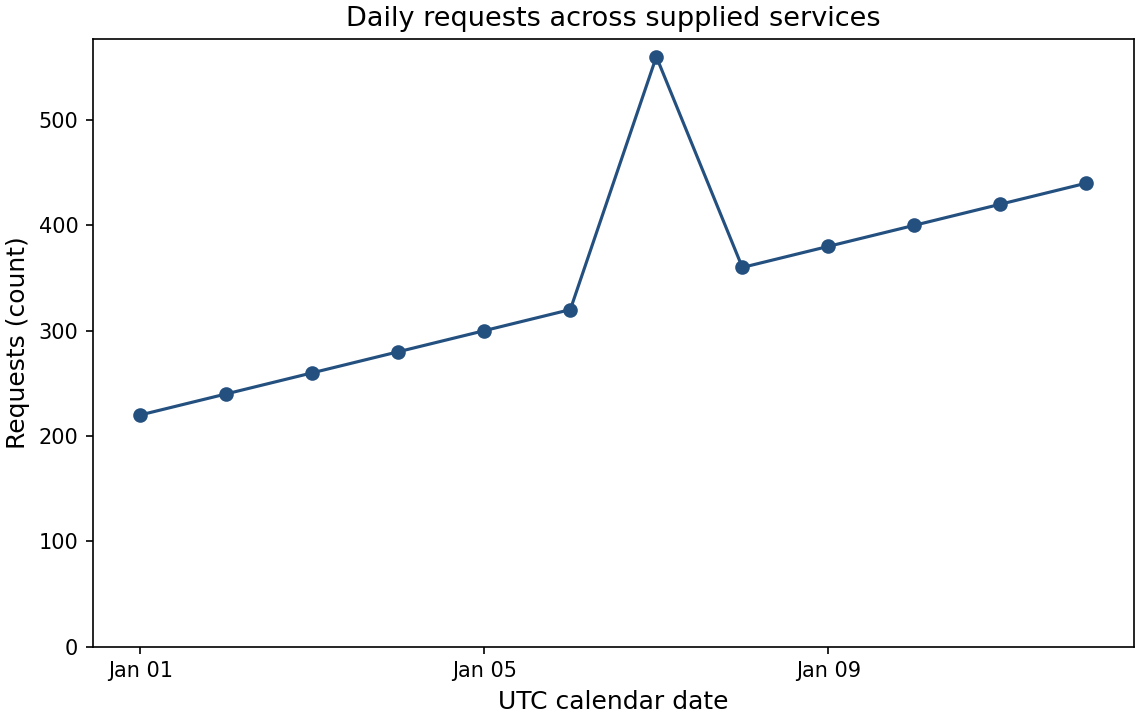
| date | requests | services_observed |
|---|---|---|
| 2027-01-01 | 220 | 2 |
| 2027-01-02 | 240 | 2 |
| 2027-01-03 | 260 | 2 |
| 2027-01-04 | 280 | 2 |
| 2027-01-05 | 300 | 2 |
| 2027-01-06 | 320 | 2 |
| 2027-01-07 | 560 | 2 |
| 2027-01-08 | 360 | 2 |
| 2027-01-09 | 380 | 2 |
| 2027-01-10 | 400 | 2 |
| 2027-01-11 | 420 | 2 |
| 2027-01-12 | 440 | 2 |
Request Latency
Download request latency table (CSV)
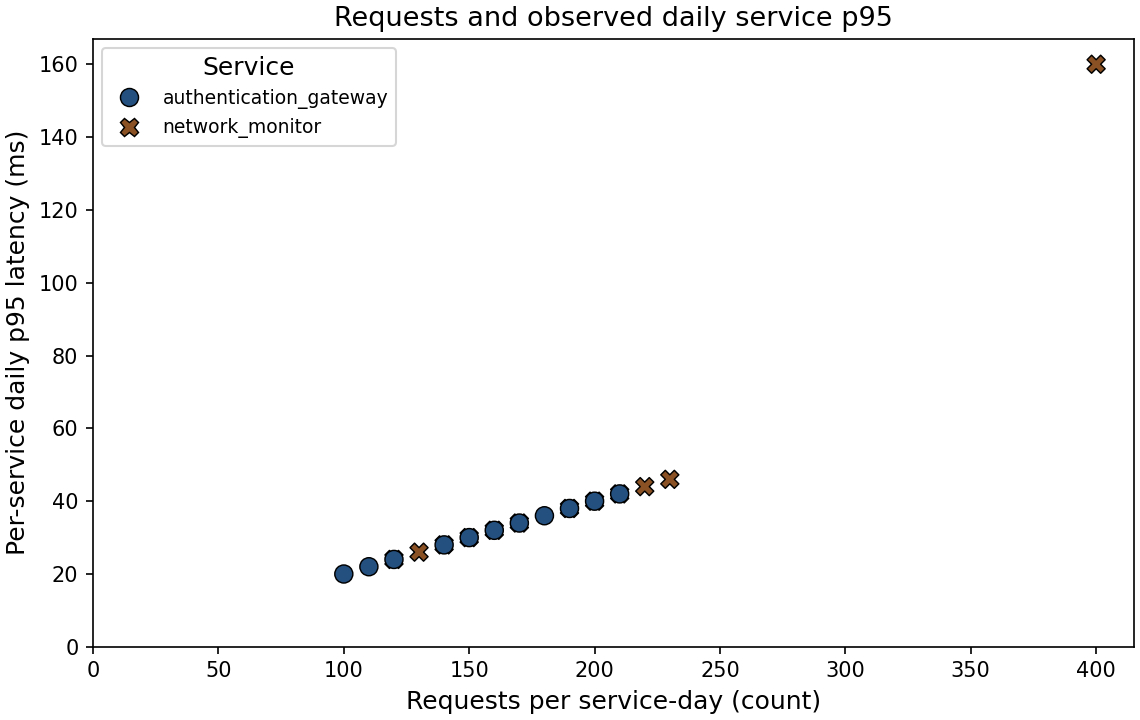
| date | service | requests | p95_latency_ms |
|---|---|---|---|
| 2027-01-01 | authentication_gateway | 100 | 20.0 |
| 2027-01-01 | network_monitor | 120 | 24.0 |
| 2027-01-02 | authentication_gateway | 110 | 22.0 |
| 2027-01-02 | network_monitor | 130 | 26.0 |
| 2027-01-03 | authentication_gateway | 120 | 24.0 |
| 2027-01-03 | network_monitor | 140 | 28.0 |
| 2027-01-04 | network_monitor | 150 | 30.0 |
| 2027-01-05 | authentication_gateway | 140 | 28.0 |
| 2027-01-05 | network_monitor | 160 | 32.0 |
| 2027-01-06 | authentication_gateway | 150 | 30.0 |
| 2027-01-06 | network_monitor | 170 | 34.0 |
| 2027-01-07 | authentication_gateway | 160 | 32.0 |
| 2027-01-07 | network_monitor | 400 | 160.0 |
| 2027-01-08 | authentication_gateway | 170 | 34.0 |
| 2027-01-08 | network_monitor | 190 | 38.0 |
| 2027-01-09 | authentication_gateway | 180 | 36.0 |
| 2027-01-09 | network_monitor | 200 | 40.0 |
| 2027-01-10 | authentication_gateway | 190 | 38.0 |
| 2027-01-10 | network_monitor | 210 | 42.0 |
| 2027-01-11 | authentication_gateway | 200 | 40.0 |
| 2027-01-11 | network_monitor | 220 | 44.0 |
| 2027-01-12 | authentication_gateway | 210 | 42.0 |
| 2027-01-12 | network_monitor | 230 | 46.0 |
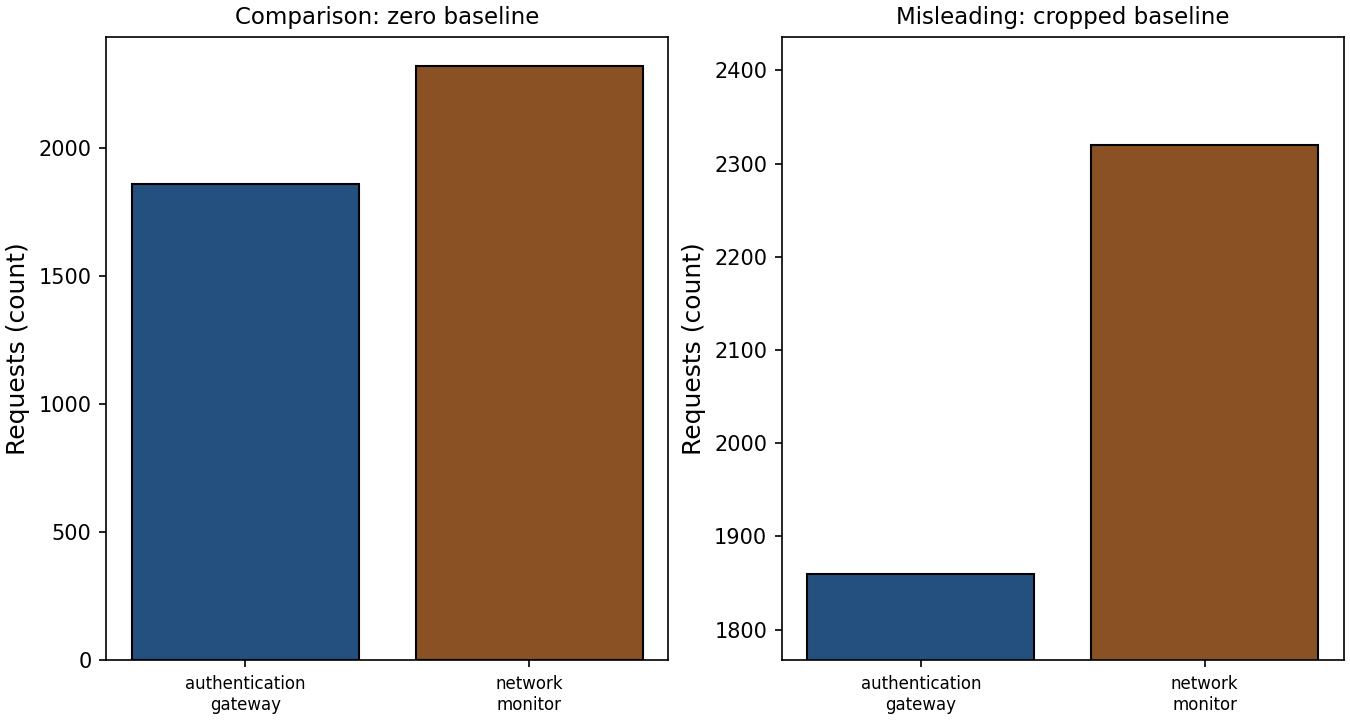
Axis Comparison
Download axis comparison table (CSV)
| service | requests |
|---|---|
| authentication_gateway | 1860 |
| network_monitor | 2320 |